

Debugging is honestly one of the most important aspects of software development, as it allows developers to find and resolve bugs before deploying the software to production. Instead of putting Console.WriteLine() statements on every corner of your code, VS Code has a lot of built-in functionalities, including debugging tools to help make the debugging process more efficient and simpler.
In this article, you will configure VS Code to debug C# and .NET Core applications by installing the C# extension by Microsoft, creating debug configuration files, and setting breakpoints.
Prerequisites
Before you begin, you will need:
- ASP.NET Core SDK installed locally, which you can do by visiting the official .NET website.
- The latest version of VS Code installed on your system.
- C# extension by Microsoft installed
The C# extension by Microsoft offers powerful lightweight development tools to bring cross-platform C# development in VS Code. This extension also provides fantastic features like:
- C# editing support, including Syntax Highlighting, IntelliSense, and many more.
- Debugging support for .NET Core applications
Step 1 – Create a Simple C# Console App
To avoid overcomplicating the debugging process, let’s use the .NET CLI to generate a simple C# console project with the dotnet new <TEMPLATE>command, where <TEMPLATE> is the application type.
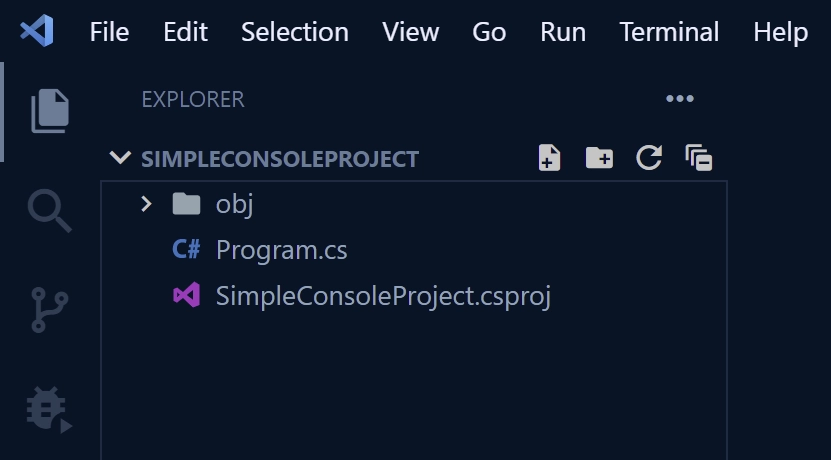
To generate the C# console application, execute the command dotnet new console --name <NAME> , the <NAME> parameter sets the name of the C# console project and the directory to be created. By default, the current directory name will be used if the <NAME> parameter is omitted.
dotnet new console --name SimpleConsoleProject && cd SimpleConsoleProject && code .
The above commands will execute the .NET project scaffolding tool to create a simple Hello World starter console application with some basic configuration and open the newly-created project with VS Code.
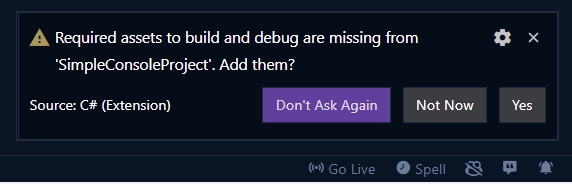
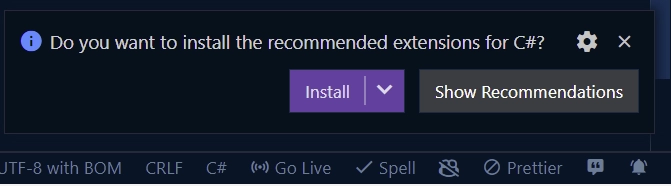
After Visual Studio Code has finished setting up the workspace environment, the C# extension will immediately show a popup with the message – Required assets to build and debug are missing from ‘SimpleConsoleProject‘. Add them? – Click Yes to automatically generate and output the launch.json and tasks.json files into a .vscode folder.
Note: This is only possible if you have the C# extension by Microsoft installed.
If you don’t have the C# extension already installed, VS Code will prompt you to install it as soon as you open the C# file.
Step 2 – Generate the Build and Debug Assets for C#
If by any chance you didn’t get the VS Code popup notification to generate the build and debug files, click on the debugger tab on the left sidebar of VS Code and click on the Generate C# Assets for Build and Debug button.
Note: This is only possible if you have the C# extension by Microsoft installed.
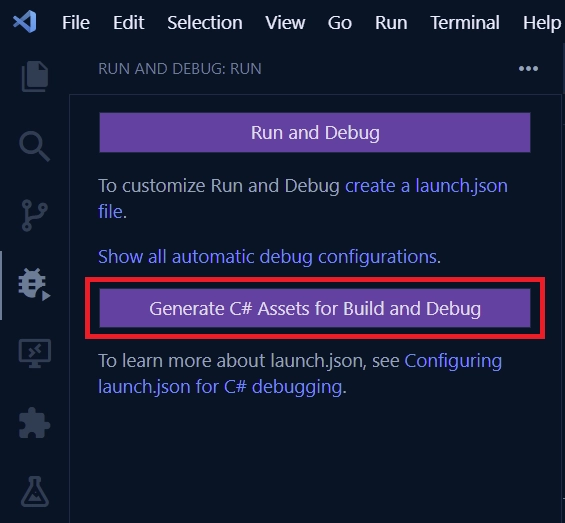
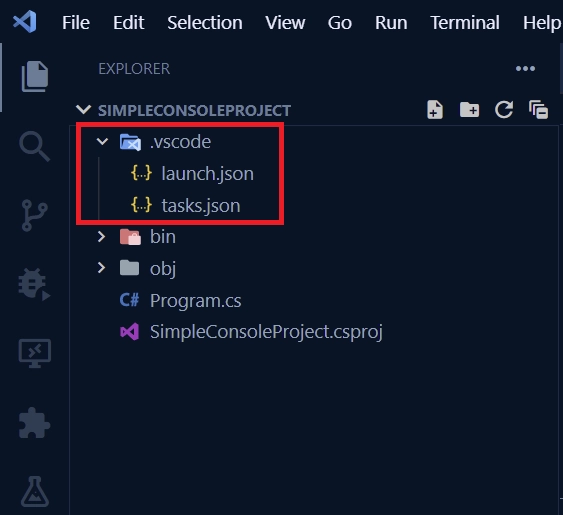
Clicking the button will generate the files needed to build, debug and launch the C# application.
The tasks.json file contains the configurations for tasks (e.g. build, publish, watch, launch, etc) that are to be executed by VS Code.
The launch.json file contains the debugging configuration information.
These two files allow Visual Studio Code to build and launch the project in debug mode.
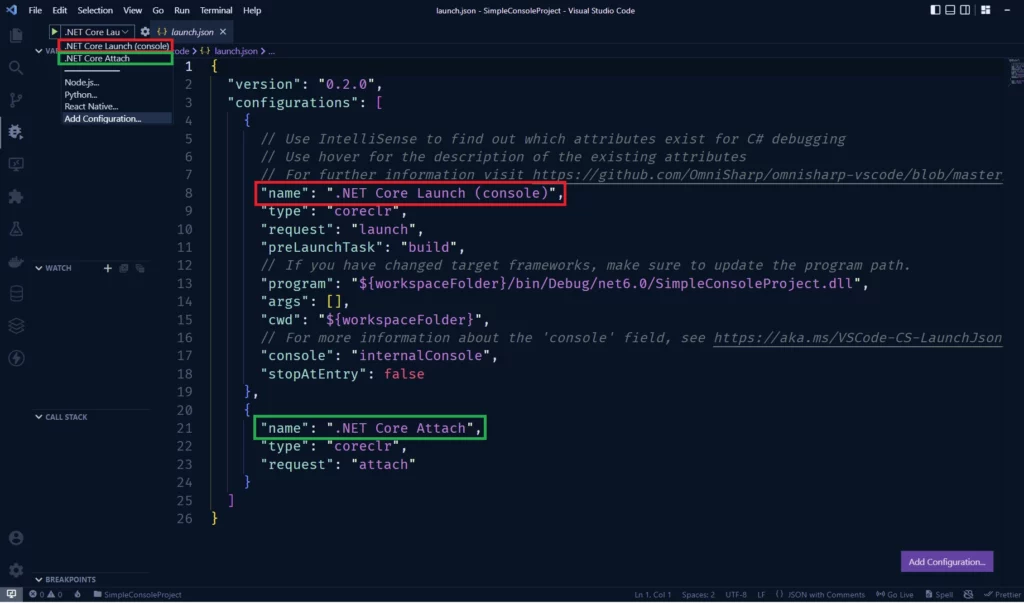
Now open the launch.json file and the VS Code debugger panel. On the debugger panel, click on the dropdown list adjacent to the play button to see the available tasks.
.vscode/launch.json
{
  "version": "0.2.0",
  "configurations": [
    {
      // Use IntelliSense to find out which attributes exist for C# debugging
      // Use hover for the description of the existing attributes
      // For further information visit https://github.com/OmniSharp/omnisharp-vscode/blob/master/debugger-launchjson.md
      "name": ".NET Core Launch (console)",
      "type": "coreclr",
      "request": "launch",
      "preLaunchTask": "make this work",
      // If you have changed target frameworks, make sure to update the program path.
      "program": "${workspaceFolder}/bin/Debug/net6.0/SimpleConsoleProject.dll",
      "args": [],
      "cwd": "${workspaceFolder}",
      // For more information about the 'console' field, see https://aka.ms/VSCode-CS-LaunchJson-Console
      "console": "internalConsole",
      "stopAtEntry": false
    },
    {
      "name": ".NET Core Attach",
      "type": "coreclr",
      "request": "attach"
    }
  ]
}
Let’s evaluate the first configuration (.NET Core Launch (console)) in the list. It launches the program ${workspaceFolder}/bin/Debug/net6.0/SimpleConsoleProject.dll , which is the .dll that will be generated when we build the application. You can also pass arguments to the main method through the "args":[] property.
It also uses the internal console compared to Visual Studio which uses an external console.
The second configuration (.NET Core Attach) allows you to attach the VS Code debugger to a running instance of a .NET application.
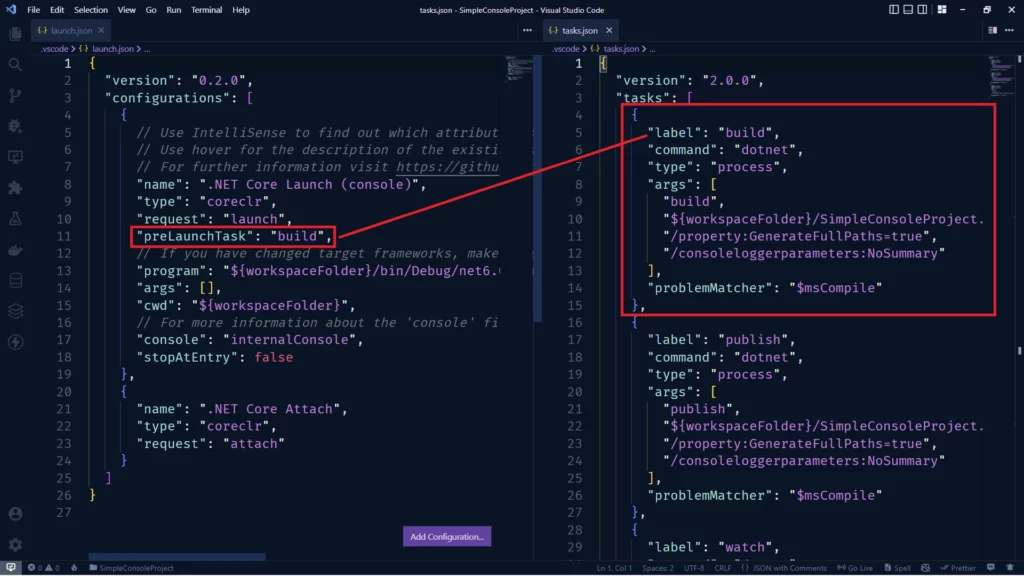
Now open the tasks.json and the launch.json files side-by-side to help us understand them better.
We have the "preLaunchTask": "build" in the launch.json file which corresponds to the "label": "build" task in the tasks.json .
The "label": "build" task runs the dotnet build command and specifies the project to build in the "args": [] property.
We also have two additional tasks "label": "publish" and "label": "watch" .
.vscode/tasks.json
{
  "version": "2.0.0",
  "tasks": [
    {
      "label": "build",
      "command": "dotnet",
      "type": "process",
      "args": [
        "build",
        "${workspaceFolder}/SimpleConsoleProject.csproj",
        "/property:GenerateFullPaths=true",
        "/consoleloggerparameters:NoSummary"
      ],
      "problemMatcher": "$msCompile"
    },
    {
      "label": "publish",
      "command": "dotnet",
      "type": "process",
      "args": [
        "publish",
        "${workspaceFolder}/SimpleConsoleProject.csproj",
        "/property:GenerateFullPaths=true",
        "/consoleloggerparameters:NoSummary"
      ],
      "problemMatcher": "$msCompile"
    },
    {
      "label": "watch",
      "command": "dotnet",
      "type": "process",
      "args": [
        "watch",
        "run",
        "--project",
        "${workspaceFolder}/SimpleConsoleProject.csproj"
      ],
      "problemMatcher": "$msCompile"
    },
    {
      "label": "test",
      "command": "dotnet",
      "type": "process",
      "args": ["test", "${workspaceFolder}/SimpleConsoleProject.csproj"],
      "problemMatcher": "$msCompile"
    },
    {
      "label": "make this work",
      "dependsOn": ["build", "test"],
      "problemMatcher": "$msCompile"
    }
  ]
}
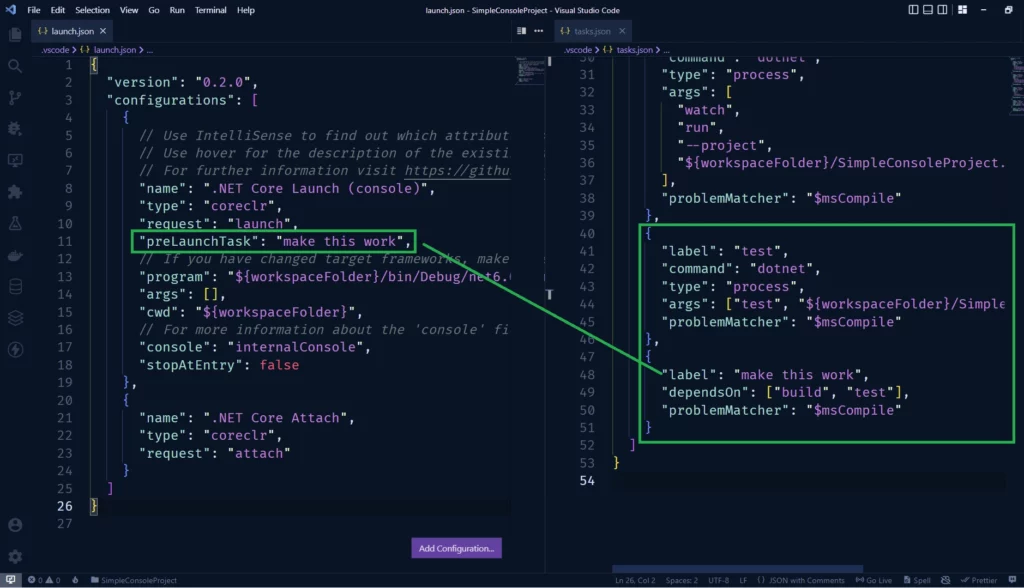
You are also allowed to add your own tasks. For example: create a task called "label": "test" and "label": "make this work" that will depend on the build and test tasks.
Next, add the "label": "make this work" task to the "preLaunchTask": "" property in the launch.json file.
Step 3 – Create a Breakpoint
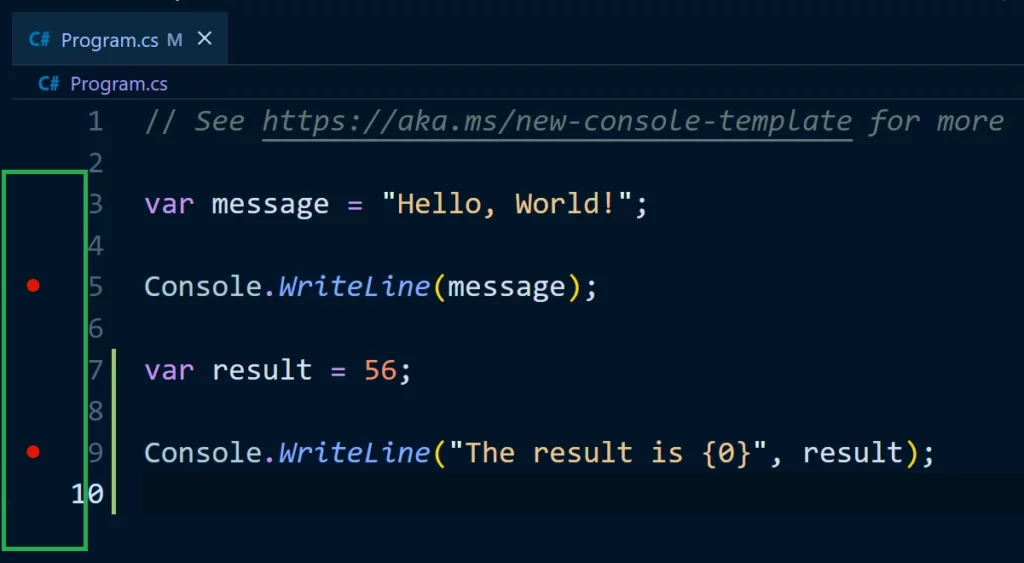
A breakpoint is a point in the code where you want the code execution to stop to enable you to inspect the memory addresses and get detailed insight into the state of the memory.
For example, if you set a breakpoint at line 5 and run the code in debugger mode, the code will execute and freeze at line 5.
To create a breakpoint, click on the gutter adjacent to the line numbers in the editor. When you hover your mouse across the gutter, you will see red circles appearing on each line.
Now click on the red circle on the gutter where you want to stop the execution of the code to activate the breakpoint on that line.
Step 4 – Start the VS Code Debugger
Now start the debugger by clicking on the play button in the VS Code debugger panel or using F5. This will run the program and pause the code at the first breakpoint where you can inspect the state of the variables in the VARIABLES pane.
Also, you can hover your mouse on the line of the current breakpoint highlighted in yellow to inspect the values of the variable.
Next, use the debugger navigation buttons to move the execution of the code line by line.
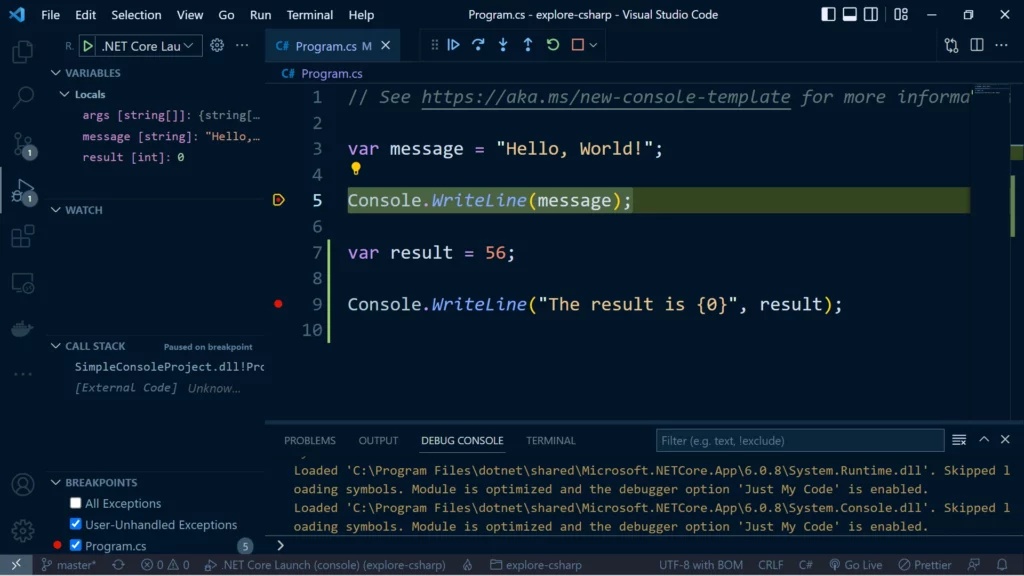
Meanwhile, the WATCH panel in VS Code lets you see the value of a variable or an expression from the program’s current state. The WATCH panel is useful if you want to see some information as you are moving the execution of your program from line to line.
Step 5 – Install the Recommended VS Code Extensions
Now let’s discourse the different extensions that I will recommend when you are coding in C# and Dotnet. To create an IDE-like experience in Visual Studio Code, these are the extensions I will install without thinking twice.
To get a full list of all extensions, follow the Top 10 VS Code Extensions for C# and .NET Development.
1 – Roslynator
2 – .NET Core Test Explorer
3 – Auto-Using for C#
4 – C# Namespace Autocompletion
Conclusion
In this comprehensive guide, you learned how to set up VS Code to debug C# and .NET programs. With this knowledge, you can start debugging your projects with ease in VS Code.
This is super helpful. Thanks for sharing!
Am glad you found the article helpful. Cheers and happy coding.
Incredibly helpful – thanks a million!
I am glad the article was helpful to you.